How to use this website
On this page you’ll find a simple guide to help you get the most out of the Canary Islands Tourism Observatory. We explain the different ways to search for data, how to explore it and how to use it, so you can fully understand all the possibilities the platform offers.
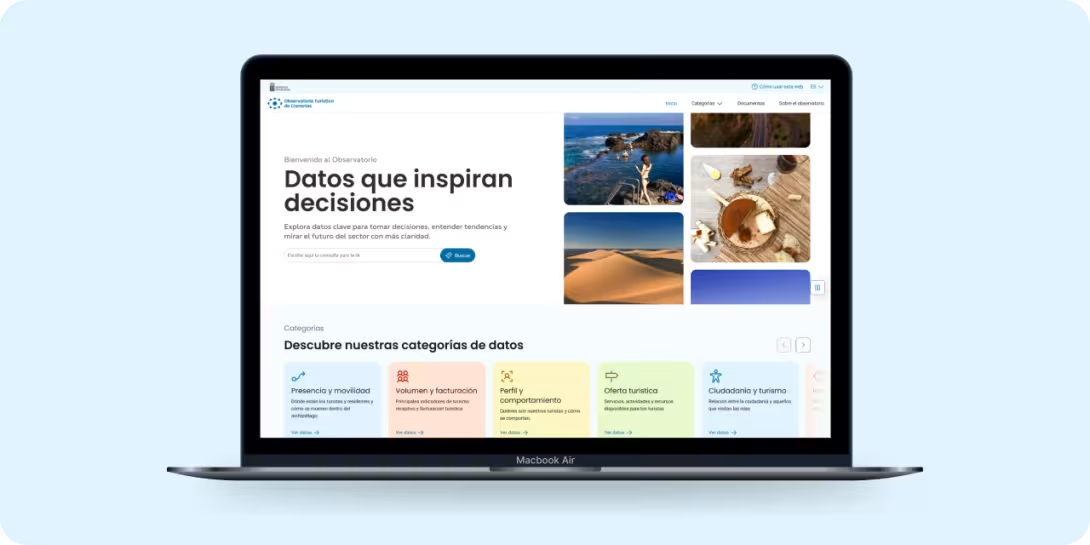
AI-powered search
The AI-powered search helps you find the information you need.
You can start a search from the homepage or via the top navigation menu, available on any section of the website.
When you enter your query, you’ll receive an AI-generated response along with interactive dashboards and related documents that you can explore to expand the information.
You don’t need to phrase your question precisely: artificial intelligence interprets your search and provides a clear summary, as well as the most relevant content available on the platform.

Example queries:
- How many German tourists arrived in La Palma in February 2023?
- Average daily expenditure of French tourists in 2024
- How many mainland Spanish tourists booked a package holiday in the first quarter of 2025?
Dynamic reports
Dynamic reports allow you to explore and understand large volumes of data interactively, supporting informed decision-making.
Dynamic reports are organised by data categories and can be accessed from the homepage, by opening “Dynamic reports” in the top navigation menu and browsing through the categories and their metrics, or via the “Discover our data categories” section.
Once inside, you’ll find dynamic reports that allow you to interact with the data: apply filters, select time periods, compare islands or markets, and see how charts update in real time. This way, you can adapt the visualisation to your needs and gain a more comprehensive view of tourism in the Canary Islands.
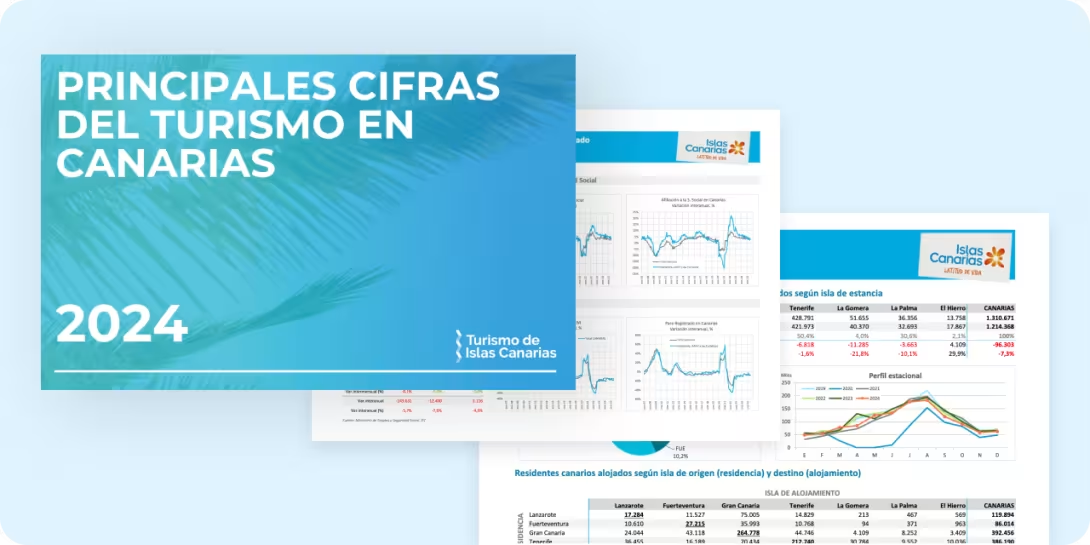
Documents
A space to access detailed, in-depth information about tourism in the Canary Islands.
The documents section is designed for users who need more detailed and comprehensive information. You can access it from the top navigation menu or view the most recent documents from the homepage. You’ll find different ways of interpreting the data, such as data sheets, infographics, presentations, and ad-hoc studies, all classified by category, metric, analysis period, and more.
Each document can be previewed directly on the Observatory website and, if you prefer, downloaded for use in your own analyses, projects, or presentations. Some documents also include the option to download the time series in XLS format.
To make searching easier, you can use the search tool when you know which document you’re looking for, or apply filters and sort results until you find the document you need.
Data usage
In the Observatory you’ll find different datasets presented through dashboards and documents. Most of the data comes from official and public sources, so you’re free to use it in your own analyses, reports, or presentations.
When sharing this data, please remember to always cite the original source and the Canary Islands Tourism Observatory, and include a link to the corresponding page whenever possible.